Products
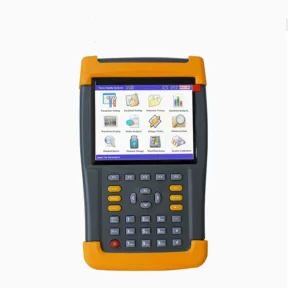
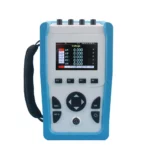
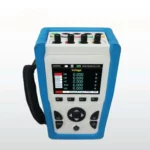
Related products


Company Profile
The company specializes in the research anddevelopment, production, sales, and service of electric power system automation testing equipment, providing customers with one-stop services.
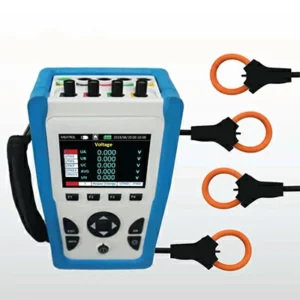
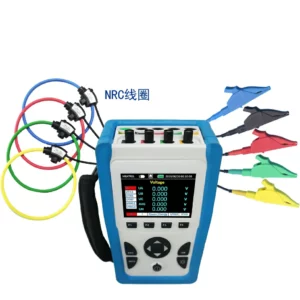
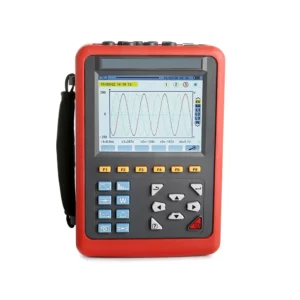
Product Introduction
Real-Time Measuring
The following table lists the metering characleristics of the pover meler for the real-lime
measurement :
Minimum/Maximum Values
When any ome-second real-ime reading reaches its highest or lowest value,the power meler saves the minimum and maximum values in its nonvolatile memory.
From the power meter display,you can:
- view all min./max.values since the last reset and the reset date and time.
- reset min /max.values.
All running min.max.values are arthmetic minimum and maximum values.For example,the mirimum phase A-N voltage is the lowest value in the range from 0 to 999.9GV that has occurred since last reset of the min/max.values.
The power meter provides time stamping for all minimum/maximum values.
The following table lists the minimum and maximum values stored in the power meter:
Demand Readings
The power meter provides the fallowing demand readings.
Demand Calculation Methods
Power demand is the energy accumulated during a specied period divided by the length of the period.Curent demand is calculated using anithmetical integration of the current RMS values during a time period,divided by the length of the period. How the power meter performs this calculation depends on the selected method.To be compatible with electric utitybiling practices,the power meter prowides block interval powericurrent demand calculafions.
For block interval demand calculations,you select a block of time (interval)that the power meter uses for the demand calculation and the mode the meter uses to handle he interval.2 different modes are possible:
- Fixed block-Select an interval fom 1 to 60 minutes (n 1 minute increments).The power meter calculates and updates the demand at the end of each interval
- Siding block-Select an interval from 1 to 60 minutes (in 1 minute increments).For demand intervals less than 15 minutes,the value is updaled every 15 seconds.For demand intervals of 15 minutes and grealer,the demand value is updated every 60 seconds.The power meter displays the demand value for the last completed interval.
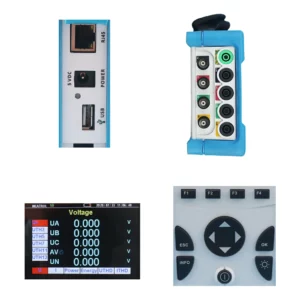
Product Detail